


Create new insight for your team
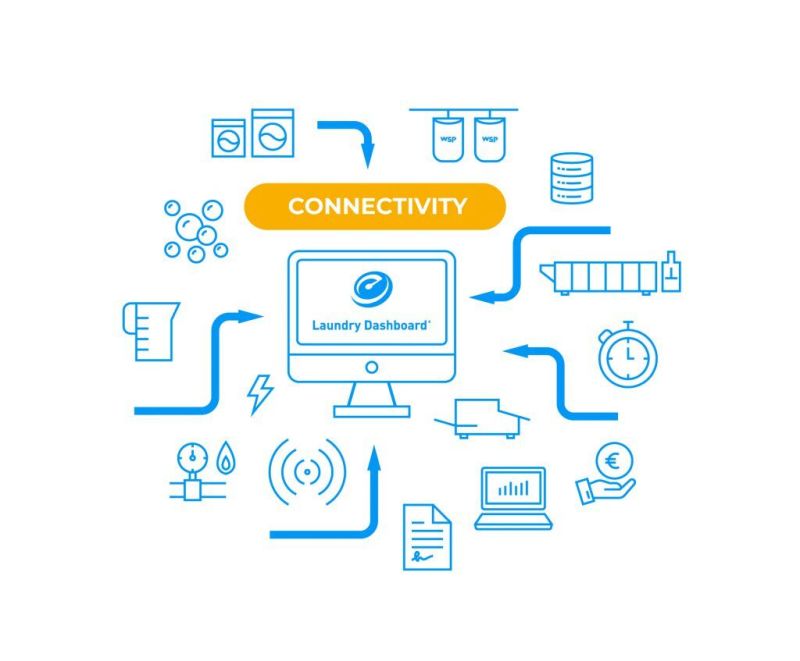
Laundry Dashboard lets you increase productivity by creating insight into important variables. And connectivity is key, because Laundry Dashboard obtains data from the production process as well as from other systems.
Core performance is shown in accessible dashboards. In real-time. Examples include production per hour/per team, production compared to (your pre-determined) standards, daily production processes per machine, average employee performance per production department, consumption of gas, electricity, and water compared to total laundry production, machine Overall Equipment Effectiveness (OEE), etc.
Discover the hidden potential
Resources
Obviously, you are aware of how much gas, water and electricity is consumed by your laundry. In general. But what exactly causes the peaks and troughs and inefficiencies? For which machines, at what time, for which types of laundry and for which customer?
Productivity
You utilise modern machines and motivated staff. You know what they are able to cope with. Your machines are operating at full capacity and your staff work hard. But when does the process lead to a delay or even a standstill? How much of the productivity is lost unnoticed? Which orders lead to more demand on your team than they can actually deliver? Do you know exactly?
Sales
You have long-term relationships. Contracts that guarantee turnover. Customers you cherish. But how profitable are they really? How efficiently is the laundry of a specific customer being handled by your laundry? How much sharper can you calculate – and which orders do in fact cost money?
Simply know how you perform: good for 4% more productivity
(and that can go up to 23%!)
Production capacity
Thanks to information from Laundry Dashboard you can make targeted investments in human and machine capacity. But not before optimising current capacity utilisation.
Insight into OEE
Create insight into the Overall Equipment Effectiveness (OEE) of your machines to effectively identify losses and opportunities for improvement.
Client profitability
Loyal customers and promising prospects. Are they helping to improve your turnover? Really? Laundry Dashboard creates insight into client profitability, accurate to a kilogram.
Benchmarking
Want to compare your facilities? Laundry Dashboard lets you perform internal benchmarks. Compare performances to create new insight.
Assessments and reviews
Information from Laundry Dashboard is always objective – making it an excellent basis for performance assessments and reviews between supervisors and their teams or employees.
Footprint
Decrease your ecological footprint through Laundry Dashboard. Make the most accurate adjustments based on real-time data of resource usage, including gas, water, and electricity.
Take the test!
Want to know more about how Laundry Dashboard would work in practice for your business? Allow yourself to be convinced by our one-of-a-kind test setup. The trial setup can easily be installed by yourself.
- Available within three weeks
- Plug & play
- Free training
- Immediate results
- Three-month zero licence fees
- No-good money-back guarantee